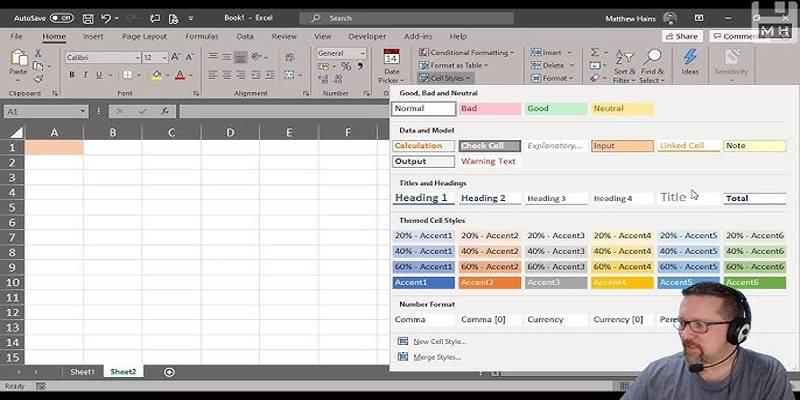
When you use spreadsheets, data is more than just numbers. It's also how those numbers are shown, analyzed, and understood. One of the most popular tools for managing and analyzing data is Microsoft Excel. It has powerful layout options that are essential for getting information across.
Data formatting in Excel goes beyond aesthetics. It impacts how easily others can read your spreadsheets, how accurate your reports appear, and how efficiently insights can be derived. This post will explore what data formatting means in Excel, why it matters, the different types of formatting available, and how to use them properly.
Data Formatting in Excel
Data formatting in Excel refers to the process of adjusting the appearance and presentation of data in a worksheet without changing the underlying values. Whether it’s changing a cell’s font color or converting a number to a currency format, formatting helps make data more readable and actionable.
For analysts and business professionals, formatting is essential. A poorly formatted report can lead to confusion, misinterpretation, and even critical business mistakes. On the other hand, well-formatted spreadsheets enhance data clarity, highlight key information, and support informed decision-making.
Why Is Formatting Important?
Here are a few reasons why formatting should never be overlooked:
- Improves data clarity: Well-formatted data is easier to scan, analyze, and understand.
- Highlights key information: Conditional formatting helps emphasize high or low values, trends, and anomalies.
- Supports accuracy: Ensures data types are consistently represented (e.g., dates, currency).
- Reduces errors: Helps prevent misinterpretation caused by incorrect visual presentation.
- Enhances professionalism: Clean, well-formatted reports are essential for client presentations and executive summaries.
In short, formatting is not just decoration—it’s a critical step in data presentation.
Excel Data Formatting: Core Areas
Excel offers a wide range of formatting options to help users organize and present data more effectively. These include:
- Cell-level formatting: Visual adjustments to individual or grouped cells
- Number formatting: Ensures numerical data is interpreted correctly
- Conditional formatting: Automatically highlights values based on rules
- Other Useful Formatting Options: Includes custom formats, clipboard tools, and style themes to refine data presentation
Understanding these options can dramatically improve your reporting quality and user experience.
1. Cell-Level Formatting Techniques

Cell formatting controls the visual layout of the data. These settings don’t change the value inside the cell but affect how the data looks on the screen or in print.
Aspect | Description | Example |
|---|---|---|
Font Customization | Change font family, size, and style | Arial, 12pt, Bold |
Text Color | Set the font color to distinguish categories or values | Red, Blue, Green |
Cell Background Color | Use fill colors to emphasize or group data | Yellow, Light Grey |
Cell Borders | Add lines around cells to define sections | Thin, Thick, Double lines |
Clipboard Paste Options | Copy and paste only specific cell attributes | Paste Values, Paste Format |
Using these formatting tools helps in making spreadsheets easier to navigate and more visually structured, especially in large datasets or printed reports.
2. Understanding Number Formatting
Number formatting determines how numerical values are displayed in a cell. It includes digits, decimal points, currency symbols, dates, percentages, and scientific notations. Proper number formatting prevents data misinterpretation and makes your reports cleaner and more precise.
Common Number Formats:
Format Type | Purpose | Example |
|---|---|---|
General | Default, shows numbers as typed | 1234 |
Number | Adds commas, defines decimal places | 1,234.56 |
Currency | Displays numbers with a currency symbol | $1,234.56 |
Accounting | Aligns currency symbols neatly in reports | $ 1,234.56 |
Date and Time | Converts serial numbers into readable dates/times | 08/28/2024, 14:30 |
Percentage | Converts decimals into percentage form | 0.12 → 12% |
Fraction | Displays values as fractions | 1.5 → 1 1/2 |
Scientific | Shows large/small numbers in scientific notation | 1.23E+03 |
Text | Treats numeric values as plain text | "1234" |
Special | For custom formats like phone numbers, ZIP codes | (123) 456-7890 |
Incorrect number formatting can result in serious errors—such as omitting currency signs in financial reports or misrepresenting percentages. Always choose the format that best fits the data’s meaning and context.
3. Conditional Formatting
Conditional formatting is a dynamic feature in Excel that allows you to automatically change cell appearance based on its value.
Common Conditional Formatting Uses:
- Highlight sales greater than the target amount
- Identify duplicate entries
- Flag overdue dates or low-performing categories
- Apply color scales or icon sets to visualize performance
Conditional formatting helps users quickly identify data that requires attention without having to manually review every value.
4. Other Useful Formatting Options
In addition to basic cell and number formatting, Excel offers advanced features that allow for more tailored and professional data presentation.
Custom Number Formats
You can create custom formats to display data in specific ways—for example, showing negative numbers in red, appending units like "kg", or formatting phone numbers.
Table Formatting
Converting data ranges into tables adds visual styling, automatic filtering, and dynamic formula referencing, making data easier to manage.
Format Painter
This tool copies formatting from one cell or range to another, helping maintain consistency across your spreadsheet.
These features save time, reduce manual formatting, and help present data in a cleaner, more effective way.
Common Formatting Mistakes to Avoid

Even experienced Excel users can fall into formatting traps that reduce the clarity or accuracy of their data. Here are some common mistakes:
- Inconsistent data types in the same column (e.g., mixing text and numbers)
- Overusing colors or fonts can make spreadsheets look cluttered
- Forgetting to format currency or percentages, leading to confusion
- Merging cells unnecessarily can disrupt sorting or filtering
- Failing to apply conditional formatting rules properly leads to errors
Always review formatting choices in the context of the data and its intended audience.
Conclusion
So, what is data formatting in Excel? It’s the process of organizing and presenting data in a way that is clean, consistent, and meaningful. Formatting allows users to better understand, interpret, and act upon data without ambiguity or confusion.
Whether you’re preparing internal reports or sharing dashboards with stakeholders, effective formatting makes a significant difference. From cell-level styling and number formatting to conditional logic and custom table designs, Excel provides all the tools needed to turn raw data into a polished, professional asset.


